International Journal of Agriculture, Environment and Biotechnology
Citation: IJAEB: 12(4): 323-329, December 2019
DOI: 10.30954/0974-1712.12.2019.5
©2019 IJAEB All rights reserved
GENETICS AND PLANT BREEDING
Variability and Path Coefficient Studies for Yield and Yield Related Traits in Rice (Oryza sativa L.)
N.D. Rathan*, S.K. Singh, R.K. Singh, Prudhvi R. Vennela, D.K. Singh, Monika Singh, Dinesh Kumar and M.A. Ashrutha
Department of Genetics & Plant Breeding, Institute of Agricultural Sciences, Banaras Hindu University, Varanasi (U.P.), India
*Corresponding author: rathanndnagl27@gmail.com (ORCID ID: 0000-0002-6372-1433)
Paper No. 800
Received: 08-07-2019
Revised: 03-10-2019
Accepted: 29-11-2019
ABSTRACT
The twenty four genotypes of rice (Oryza sativa L.) were evaluated for genetic variability, heritability, genetic advance, correlation and path coefficient analysis considering seventeen quantitative traits. The analysis of variance showed that genotypes differed significantly for all the seventeen traits studied and it is clear from the investigation that the traits like spikelet/panicle, sterile spikelet/panicle, grain weight/panicle exhibiting highest values of phenotypic and genotypic coefficient variation, heritability and genetic advance. Correlation and path analysis study revealed that the traits viz., days to maturity, plant height, effective tillers/plant and spikelet fertility percent demonstrated greater positive direct effect and significant positive correlation with grain yield/plant indicating the usefulness of these trait in selection for enhancing the grain yield.
Highlights
 The genotypes Swarna Sub1, IR 91648-B-215-B-2-1 and IR92937-178-2-2 (R-155) can be effectively utilized as donor parents in hybridization programme for yield enhancement.
Keywords: Genetic variability, Heritability, Genetic advance, Correlation, path coefficient analysis
Rice is the staple food across Asia, where around half of the world’s poorest people live and is significantly gaining its importance in Africa and American countries. In view of the growing population, the basic objective of the plant breeders would always be towards yield improvement in staple food crops. It has been estimated that the world will have to produce 60% more rice by 2030 than what it produced in 1995 (Babu et al. 2012). Hence, for enhanced food security and poverty alleviation, the increase in the rice production plays the key role. For framing the efficient breeding methodology applicable to the genetic improvement of the population, the kind of variation present in the breeding population is of great importance. Biometrical estimates like genotypic coefficient of variance (GCV) and phenotypic coefficient of variance (PCV) provides the estimates of the contribution of environment and genotype towards total variation and hence assist in framing proper breeding program. It has been found that heritability estimate with genetic advance is very effective in determining the gain through selection. Therefore genetic variation, heritability and genetic advance estimates will play an important role in exploiting future research programme of rice improvement. The quantitative traits like yield have polygenic control and are significantly influenced by the environment to which the individual is exposed and a large number of traits will contribute to the more complex trait yield, so the simple correlation studies do not provide an adequate information about the contribution of each factor towards yield. Therefore direct and indirect contribution of contributing traits on grain yield can be estimated with path analysis by partitioning the correlation coefficients and hence permits to examine the specific forces acting to produce a given correlation. Correlation and path analysis establish the extent of association between yield and its components and also bring out the relative importance of their direct and indirect effects, thus giving an obvious understanding of their association with grain yield (Babu et al. 2012). This provides the opportunity for indirect selection of yield contributing traits to enhance the grain yield.
Keeping the above points in view, the current study was aimed at estimating variability, heritability and genetic advance of the various yield contributing traits and their associations with yield by means of correlation coefficients and assessing the direct and indirect contribution of yield components on grain yield through path-coefficient analysis.
MATERIALS AND METHODS
The present investigation was conducted during the kharif season 2016-2017 at the Agricultural Research Farm, Institute of Agricultural Sciences, Banaras Hindu University, Varanasi using twenty four rice genotypes viz., IR 92522-47-2-1-4, IR 92522-45-3-1-4, IR 91648-B-85-B-1-1, IR 91648-B-215-B-2-1, IR 91648-B-58-B-7-3, IR 96321-315-402-B-1, IR 96321- 327-300-B-1-1, IR 94391-587-1-2-B, IR 85604-19-2-3-2-2, IR 82475-110-2-2-1-2, IR 96248-16-3-3-1-B, IR 96248-16-3-3-2-B, IR 97477-110-3-1-B, IR92978-192- 1-2 (R-306), IR91953-141-2-1-2 (R-119), IR92937- 178-2-2 (R-155), MTU1010, Swarna Sub1, Swarna, Lalat, R-RHZ-7, CGZR-1, IR64, Sambha mahsuri which were received from IRRI Networking Project, Institute of Agricultural Sciences, Banaras Hindu University, Varanasi. The experiment was laid out in randomized block design (RBD) with three replications. Twenty five days old seedlings were transplanted in main research plot. Each plot consisted of five rows of 1.5 m length with spacing 15 × 20 cm. The crop was maintained as per the standard agronomic practices. The field observations were recorded for 17 quantitative traits including Days to 50% flowering, days to Maturity, plant height(cm), kernel length(mm), kernel breadth(mm), kernel length breadth ratio, panicle length(cm), no. of tillers per plant, no. of effective tillers per plant, total spikelet per panicle, spikelet fertility percent, sterile spikelet per panicle, 1000 grain weight(g), grain weight per panicle(g), grain yield per plant(g). Analysis of variance is used for testing whether there is significant difference among the treatments or not by following the procedure of randomized block design (RBD) analysis (Panse and Sukhatme 1967). Phenotypic and genotypic coefficient of variation was calculated by the method suggested by Burton and Devane (1953). Categorization of the range of variation is done as proposed by Sivasubramanian and Madhavamenon (1973). Heritability was calculated by the formula given by Allard (1960) and categorized as suggested by Johnson et al. (1955). Genetic advance (Expected) i.e., expected genetic gain resulting from selecting five per cent superior plants was estimated by the formula suggested by Allard (1960) and the range of genetic advance as percent of mean was classified as suggested by Johnson et al. (1955). The standard statistical procedures of Singh and Chaudhary (1979) and Dewey and Lu (1959) were used to estimate correlation coefficients and path analysis respectively.
RESULTS AND DISCUSSION
It is noticeable from the analysis of variance that genotypes differed significantly for all the seventeen characters studied, which is presented in table 1. This specified that there is ample scope for selection of promising genotypes from present set of germplasm for yield improvement.
Per se performance: Genotype Swarna Sub1 (25.690g) recorded highest mean performance for grain yield per plant followed by IR 91648-B-215-B-2-1 (25.010g) and IR92937-178-2-2 (R-155)(24.967g) indicating that these genotypes can be used in hybridization programme in order to achieve desirable enhancement in yield. Genotype CGZR-1 was earliest in flowering and maturity suggesting that early maturity or short duration rice genotype can be evolved using this as a donor parent in hybridization programme. Genotype Lalat had highest mean performance for panicle length followed by IR 82475-110-2-2-1-2. Sambha mahsuri was the shortest and Lalat was the tallest in height.
Genetic Variability: In present investigation, the estimates of PCV were higher than their corresponding GCV for all the traits studied (Table 2). But almost all the traits considered has the small difference between PCV and GCV values specifying less effect of environment in expression of these characters suggesting phenotypic differences may be considered as genotypic difference among the genotypes for selection. These findings were in accordance with the findings of Lal and Chauhan et al. (2011); Singh et al. (2013); Lingaiah et al. (2015); Mishu et al. (2016). The traits sterile spikelet/panicle followed by spikelet/panicle and Grain weight/ panicle recorded highest values of PCV and GCV. Similar findings were reported by Lal and Chauhan (2011); Singh et al. (2011); Singh et al. (2013) and Lingaiah (2015). Whereas the traits such as hulling percent, milling percent followed by plant height, kernel breadth, panicle length, days to maturity had low estimates of PCV and GCV demonstrating that selection for these traits will be relatively less effective. However, in case of sterile spikelet per panicle the difference was relatively higher indicating relatively greater effect of environment on this trait. So that in those traits having high ECV, other variability parameters like heritability may also be taken into consideration. The GCV provides a measure of comparison of variability and sometimes give some indication regarding validity of traits for selection. However, it does not provide clean picture of the extent of genetic gain to be expected from selection of phenotypic traits, unless heritable fraction of variation (heritability) is known (Burton 1952). The high heritability was recorded for most of the traits, while hulling percent and milling percent exhibited low heritability while grain yield per plant, tillers per plant and effective tillers per plant showed moderate magnitude of heritability. Days to 50% flowering and days to maturity exhibited highest heritability followed by 1000 grain weight and kernel length. Comparable reports were also made by Singh et al. (2007); Fiyaz et al. (2011); Singh et al. (2013); Mishu et al. (2016); Islam et al. (2016). This indicated that effective selection can be done for these traits compared to others. Heritability estimates indicates both additive and non-additive gene action. So, high heritability does not always indicate high genetic gain. Heritability along with genetic advance can be used as efficient selection parameters instead of heritability alone as both together indicates that most likely the heritability is due to additive gene effects. The high heritability coupled with high genetic advance as percent of mean of 5% was recorded for days to 50% flowering, days to maturity, kernel length, LB ratio, spikelet per panicle, sterile spikelet per panicle, 1000 grain weight and grain weight per panicle indicating effectiveness of selection for the improvement of these traits. While high heritability coupled with low genetic advance as percent of mean of 5% were detected for plant height, kernel breadth and panicle length which is indicative of non-additive gene action. These results are in line with the findings of Bisne et al. (2009); Tandekar et al. (2010); Fiyaz et al. (2011); Singh et al. (2013); Tiwari (2015); and Islam et al. (2016).
Table 1: Analysis of variance (ANOVA) for 17 quantitative traits in twenty four rice genotypes
*Significant at p<0.05; **Significant at p<0.01
Days to 50% flowering (DF), days to Maturity (DM), plant height (PH), kernel length (KL), kernel breadth (KB), kernel length breadth ratio(L/B), panicle length (PL), no. of tillers per plant(TP), no. of effective tillers per plant (ETP), total spikelet per panicle (TSP), spikelet fertility percent (SF%), sterile spikelet per panicle (SSP), 1000 grain weight (TGW), grain weight per panicle (GWP), grain yield per plant (GYP).
Table 2: Variability parameters for seventeen quantitative traits in 24 rice genotypes
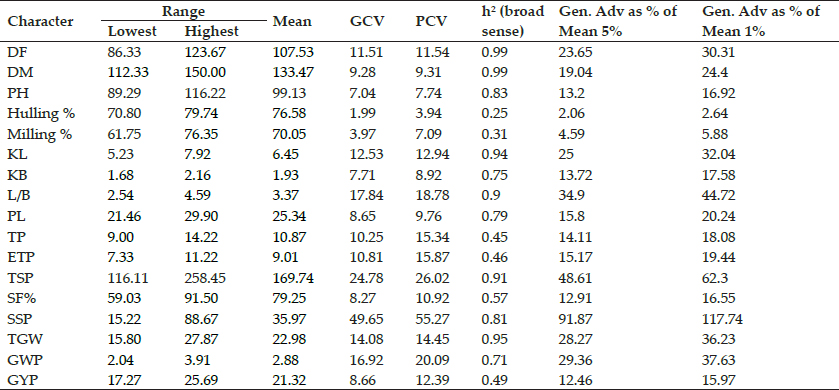
Days to 50% flowering (DF), days to Maturity (DM), plant height (PH), kernel length (KL), kernel breadth (KB), kernel length breadth ratio (L/B), panicle length (PL), no. of tillers per plant (TP), no. of effective tillers per plant (ETP), total spikelet per panicle (TSP), spikelet fertility percent (SF%), sterile spikelet per panicle (SSP), 1000 grain weight (TGW), grain weight per panicle(GWP), grain yield per plant (GYP).
Correlation: The grain yield is the complex trait controlled by minor genes and depends on many factors for its expression, selection for yield per-se is not always fruitful. Therefore it is highly desirable to include the yield attributing traits which show positive and significant association with grain yield for the yield improvement. The correlation analysis showed that the grain yield per plant had positive and significant association with effective tillers per plant, plant height, days to maturity, days to 50% flowering, Tillers per plant and spikelet fertility percent. Whereas sterile spikelet per panicle showed negative correlation with yield (Table 3). The similar results were found in the works of Nandan et al. (2010); Fiyaz et al. (2011); Singh et al. (2013); Ramanjaneyulu et al. (2014) and Kumar et al. (2016);. The traits days to 50 % flowering and days to maturity exhibited negative significant correlation with 1000 grain weight, LB ratio and demonstrated highly significant positive correlation with sterile spikelet per panicle and total spikelet per panicle indicating the reduction in grain weights but increment in total number of grain and sterile spikelets in late flowering and late maturing genotypes. Plant height revealed positive and highly significant association with panicle length, spikelet fertility percent and grain weight per panicle proved itself the efficient trait for enhancing yield when selected along with associated traits among the genotypes considered. Effective tillers per plant showed significant and positive association with tillers per plant while demonstrated negative significant association with spikelet per panicle and grain weight per panicle indicating as the number of effective tillers increases it reduces the number of spikelets and their weights in individual panicle but increases the number of panicles per plants and hence the yield (Table 3).
Path analysis: Path coefficient analysis partition the correlation coefficient into direct and indirect effect and hence provide the clear picture about whether the association of a character with grain yield is because of direct effect or because of indirect effect through other component traits and hence useful in indirect selection. The traits like days to maturity, plant height, hulling percent, kernel length, effective tillers per plant, spikelet fertility percent, sterile spikelet per panicle, grain weight per panicle exhibit positive direct effect on grain yield per plant (Table 4). Similar reports were made by Panwar and Mushiat (2007); Jayasudha and Sharma (2010); Minnie et al. (2013) and Nayak et al. (2016). Days to 50% flowering had negative direct effect on grain yield per plant and positive indirect effect through days to maturity. While days to maturity showed positive direct effect on grain yield per plant and negative indirect effect through days to 50% flowering, kernel length and spikelet per panicle indicating less days for flowering and more days for maturity (i.e., increased interval between flowering to maturity) is effective in increasing grain yield through direct selection. Whereas days to 50% flowering has significant positive total correlation with grain yield because of its indirect positive effect through traits viz., LB ratio, 1000 grain weight and grain weight per panicle, therefore it is effective to consider these traits while selecting the genotypes for late flowering. On grain yield, plant height showed positive direct effect besides positive indirect effect through grain weight per panicle. Tillers per plant revealed negative direct effect on grain yield while through effective tillers per plant showed positive indirect effect. Effective tillers per plant had positive direct effect on grain yield per plant but through grain weight per panicle exhibited negative indirect effect besides positive indirect effect through spikelet per panicle. The trait spikelet fertility percent demonstrated positive direct effect on grain yield per plant but through sterile spikelet per panicle exhibited negative indirect effect further positive indirect effect through grain weight per panicle. The traits like days to 50% flowering, days to maturity, LB ratio, spikelet per panicle, grain weight per panicle provided most of the indirect contribution for the traits considered. So that it is advised to consider these traits while practicing selection in any particular trait.
Table 3: Estimate of phenotypic correlation between yield and its attributing characters from 24 genotypes of rice
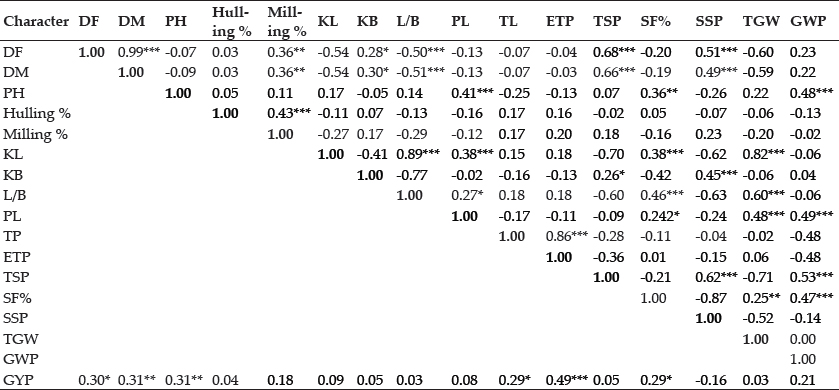
*Significant at p<0.05; **Significant at p<0.01; ***Significant at p<0.001.
Days to 50% flowering (DF), days to Maturity (DM), plant height (PH), kernel length(KL), kernel breadth(KB), kernel length breadth ratio (L/B), panicle length (PL), no. of tillers per plant(TP), no. of effective tillers per plant (ETP), total spikelet per panicle (TSP), spikelet fertility percent (SF%), sterile spikelet per panicle (SSP), 1000 grain weight (TGW), grain weight per panicle (GWP), grain yield per plant (GYP).
Table 4: Phenotypic path matrix of quantitative traits on grain yield per plant in 24 rice genotypes
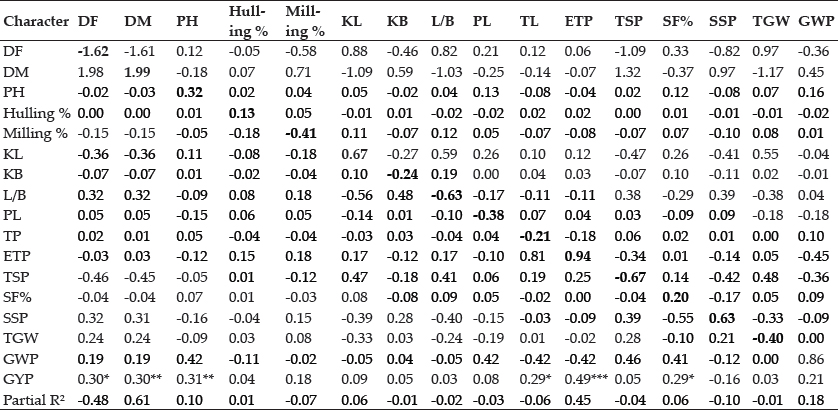
R2 = 0.6972 and Residual effect = 0.5503; values in bold characters are direct effects and rest are indirect effects.
*Significant at p<0.05; **Significant at p<0.01; ***Significant at p<0.001
Days to 50% flowering (DF), days to Maturity (DM), plant height (PH), kernel length(KL), kernel breadth (KB), kernel length breadth ratio (L/B), panicle length (PL), no. of tillers per plant(TP), no. of effective tillers per plant (ETP), total spikelet per panicle (TSP), spikelet fertility percent (SF%), sterile spikelet per panicle (SSP), 1000 grain weight (TGW), grain weight per panicle (GWP),grain yield per plant (GYP).
CONCLUSION
From the study, it is clear that the traits like spikelet per panicle, sterile spikelet per panicle, grain Weight/ Panicle exhibiting highest values of PCV, GCV, heritability and genetic advance. It is highly recommended to select these traits except sterile spikelet per panicle to attain increased yield. Sterile spikelet per panicle should be selected against because selection improves this particular trait which doesn’t have any beneficial influence on yield. While hulling percent and milling percent exhibiting low values of variance, heritability and genetic advance and hence these traits are ineffective to attain gain by practicing selection. The correlation and path studies revealed that the traits viz., days to maturity, plant height, effective tillers per plant and spikelet fertility percent demonstrated greater positive direct effect and significant positive correlation with grain yield per plant indicating the usefulness of these trait in selection for enhancing the grain yield among genotypes.
ACKNOWLEDGEMENTS
Authors thankfully acknowledge the IRRI Networking Project, IAS, BHU for providing the requisite germplasm to get this work accomplished.
REFERENCES
Allard, R.W. 1960. Principles of Plant Breeding. John Wiley and Sons Inc. London, 83-108.
Babu, V.R., Shreya, K., Dangi, K.S., Usharani, G. and Shankar, A.S. 2012. Correlation and path analysis studies in popular rice hybrids of India. International Journal of Scientific and Research Publication, 2(3): 27-36.
Bisne, R., Sarawgi, A.K. and Verulkar, S.B. 2009. Study of heritability, genetic advance and variability for yield contributing characters in rice. Bangladesh Journal of Agricultural Research, 34(2): 175-179.
Burton, G.W. and Devan, E.H. 1953. Estimating heritability in tall fescue (Festuca arundinaceae) from replicated clonal material. Agronomy Journal, 45: 478-481.
Dewey, D.R. and Lu, K.H. 1959. A correlation and path coefficient analysis of components of crested wheat grass seed production. Agronomy Journal, 51: 515-518.
Fiyaz, R.A., Ramya, K.T., Ajay, B.C., Gireesh, C. and Kulkarni, R.S. 2011. Genetic variability, correlation and path coefficient analysis studies in rice (Oryza sativa L.) under alkaline soil condition. Electronic Journal of Plant Breeding, 2(4): 531-537.
Islam M.Z., Khalequzzaman M., Bashar M.K., Ivy N.A., Haque M.M. and Mian M.A.K. 2016. Variability Assessment of Aromatic and Fine Rice Germplasm in Bangladesh Based on Quantitative Traits. The Scientific World Journal, pp. 14.
Jayasudha, S. and Sharma, D. 2010. Genetic parameters of variability, correlation and path-coefficient for grain yield and physiological traits in rice (Oryza sativa L.) under shallow lowland situation. Electronic Journal of Plant Breeding, 1(5): 1332-1338.
Johnson, H.W., Robinson, H.F. and Comstock, R.E. 1955. Estimates of genetic and environmental variability in soybeans. Agronomy journal, 47(7): 314-318.
Kumar N., Singh S.K., Singh S.P., Singh M. and Pal Mahi. 2016. Character Association and Path Analysis in Rice. Progresssive Agriculture, 16(1): 103-108.
Lal, M. and Chauhan, D.K. 2011. Studies of genetic variability, heritability and genetic advance in relation to yield traits in rice. Agricultural Science Digest, 31(3): 12-19
Lingaiah, N. 2015. Genetic variability, heritability and genetic advance in rice (Oryza sativa L.). Asian Journal of environmental Sciences, 10(1): 110-112.
Minnie C., Manikya, Reddy, Dayakar T. and Raju, Surinder C.H. 2013. Correlation and path analysis for yield and its components traits (Oryza sativa L.). Journal of Research ANGRAU, 41: 132-134.
Mishu, F.M., Rahman, W., Azad, M.A.K., Biswas, B.K., Talukder, A.I., Kayers, O., Islam, R. and Alam, R. 2016. Study on genetic variability and character association of aromatic rice (Oryza sativa L.) cultivar. International Journal of Plant and Soil Science, 9(1): 1-8.
Nandan, R., Sweta and Singh, S.K. 2010. Character Association and Path Analysis in rice (Oryza sativa L.) Genotypes. World Journal of Agricultural Sciences, 6(2): 201-206.
Nayak R., Singh V.K., Singh A.K. and Singh P.K. 2016. Genetic variability, character association and path analysis of rice genotypes. Annals of Plant and Soil Research, 18(2): 161-164..
Panse V.G. and Sukhatme P.V. 1967. Statistical methods for Agricultural workers. 2nd ed. ICAR, New Delhi, pp. 361.
Panwar, L.L. and Ali, M. 2007. Correlation and path analysis of yield and yield components in transplanted rice. ORYZA-An International Journal on Rice, 44(2): 115-120.
Ramanjaneyulu, A.V., Shankar, V.G., Neelima, T.L. and Shashibhusahn, D. 2014. Genetic analysis of rice (Oryza sativa L.) genotypes under aerobic conditions on Alfisols. SABRAO Journal of Breeding and Genetics, 46(1): 18-24.
Singh, A.K., Nandan, R. and Singh, P.K. 2013. Genetic variability and association analysis in rice germplasm under rainfed conditions. Crops Research, 47(1-3): 7-11.
Singh, A.K., Sharma, P. and Singh, P.K. 2013. Studies on Genetic Characteristic of Upland Rice (Oryza sativa L.). International Journal of Agriculture, Environment and Biotechnology, 6(4): 515-520.
Singh, R.K. and Chaudhary, B.D. 1979. Biometrical Methods in Quantitative Genetic Analysis. Kalyani Publishers, New Delhi, India.
Singh, M., Kumar, K. and Singh, R.P. 2007. Study of coefficient of variation, heritability and genetic advance in hybrid rice. ORYZA-An International Journal on Rice, 44(2): 160-162.
Singh, S.K., Singh, C.M. and Lal, G.M. 2011. Assessment of genetic variability for yield and its component characters in rice (Oryza sativa L.). Research in Plant Biology, 1(4): 14-19.
Sivasubramanian, S. and Madhavamenon, P. 1973. Combining ability in rice. Madras Agricultural Journal, 60: 419-421.
Tandekar, K., Agrawal, K. and Tirky, P. 2010. Genetic variability, heritability and genetic advance for quantitative traits in rice (Oryza sativa L.) accession. Agricultural and Biological Research, 26(1): 13-19.
Tiwari, G.C. 2015. Variability, heritability and genetic advance analysis for grain yield in rice. Journal of Engineering Research and Application, 5: 46-49.